
Understanding Query Caching in Databricks SQL Warehouses
Features, Limitations, and How to Monitor Cache Usage

Recently, I took a deep dive into SQL Warehouse query caching in Databricks. In this blog post I shared what I have learned along the way.
How to use Query Caching
The SQL query cache in Databricks SQL Warehouses1 can be a powerful tool. Once a query is sent to the Warehouse, its results are cached and reused in subsequent runs.
Query caching is automatically activated in Databricks SQL. You can check if the cache was used by looking at the statement execution details.
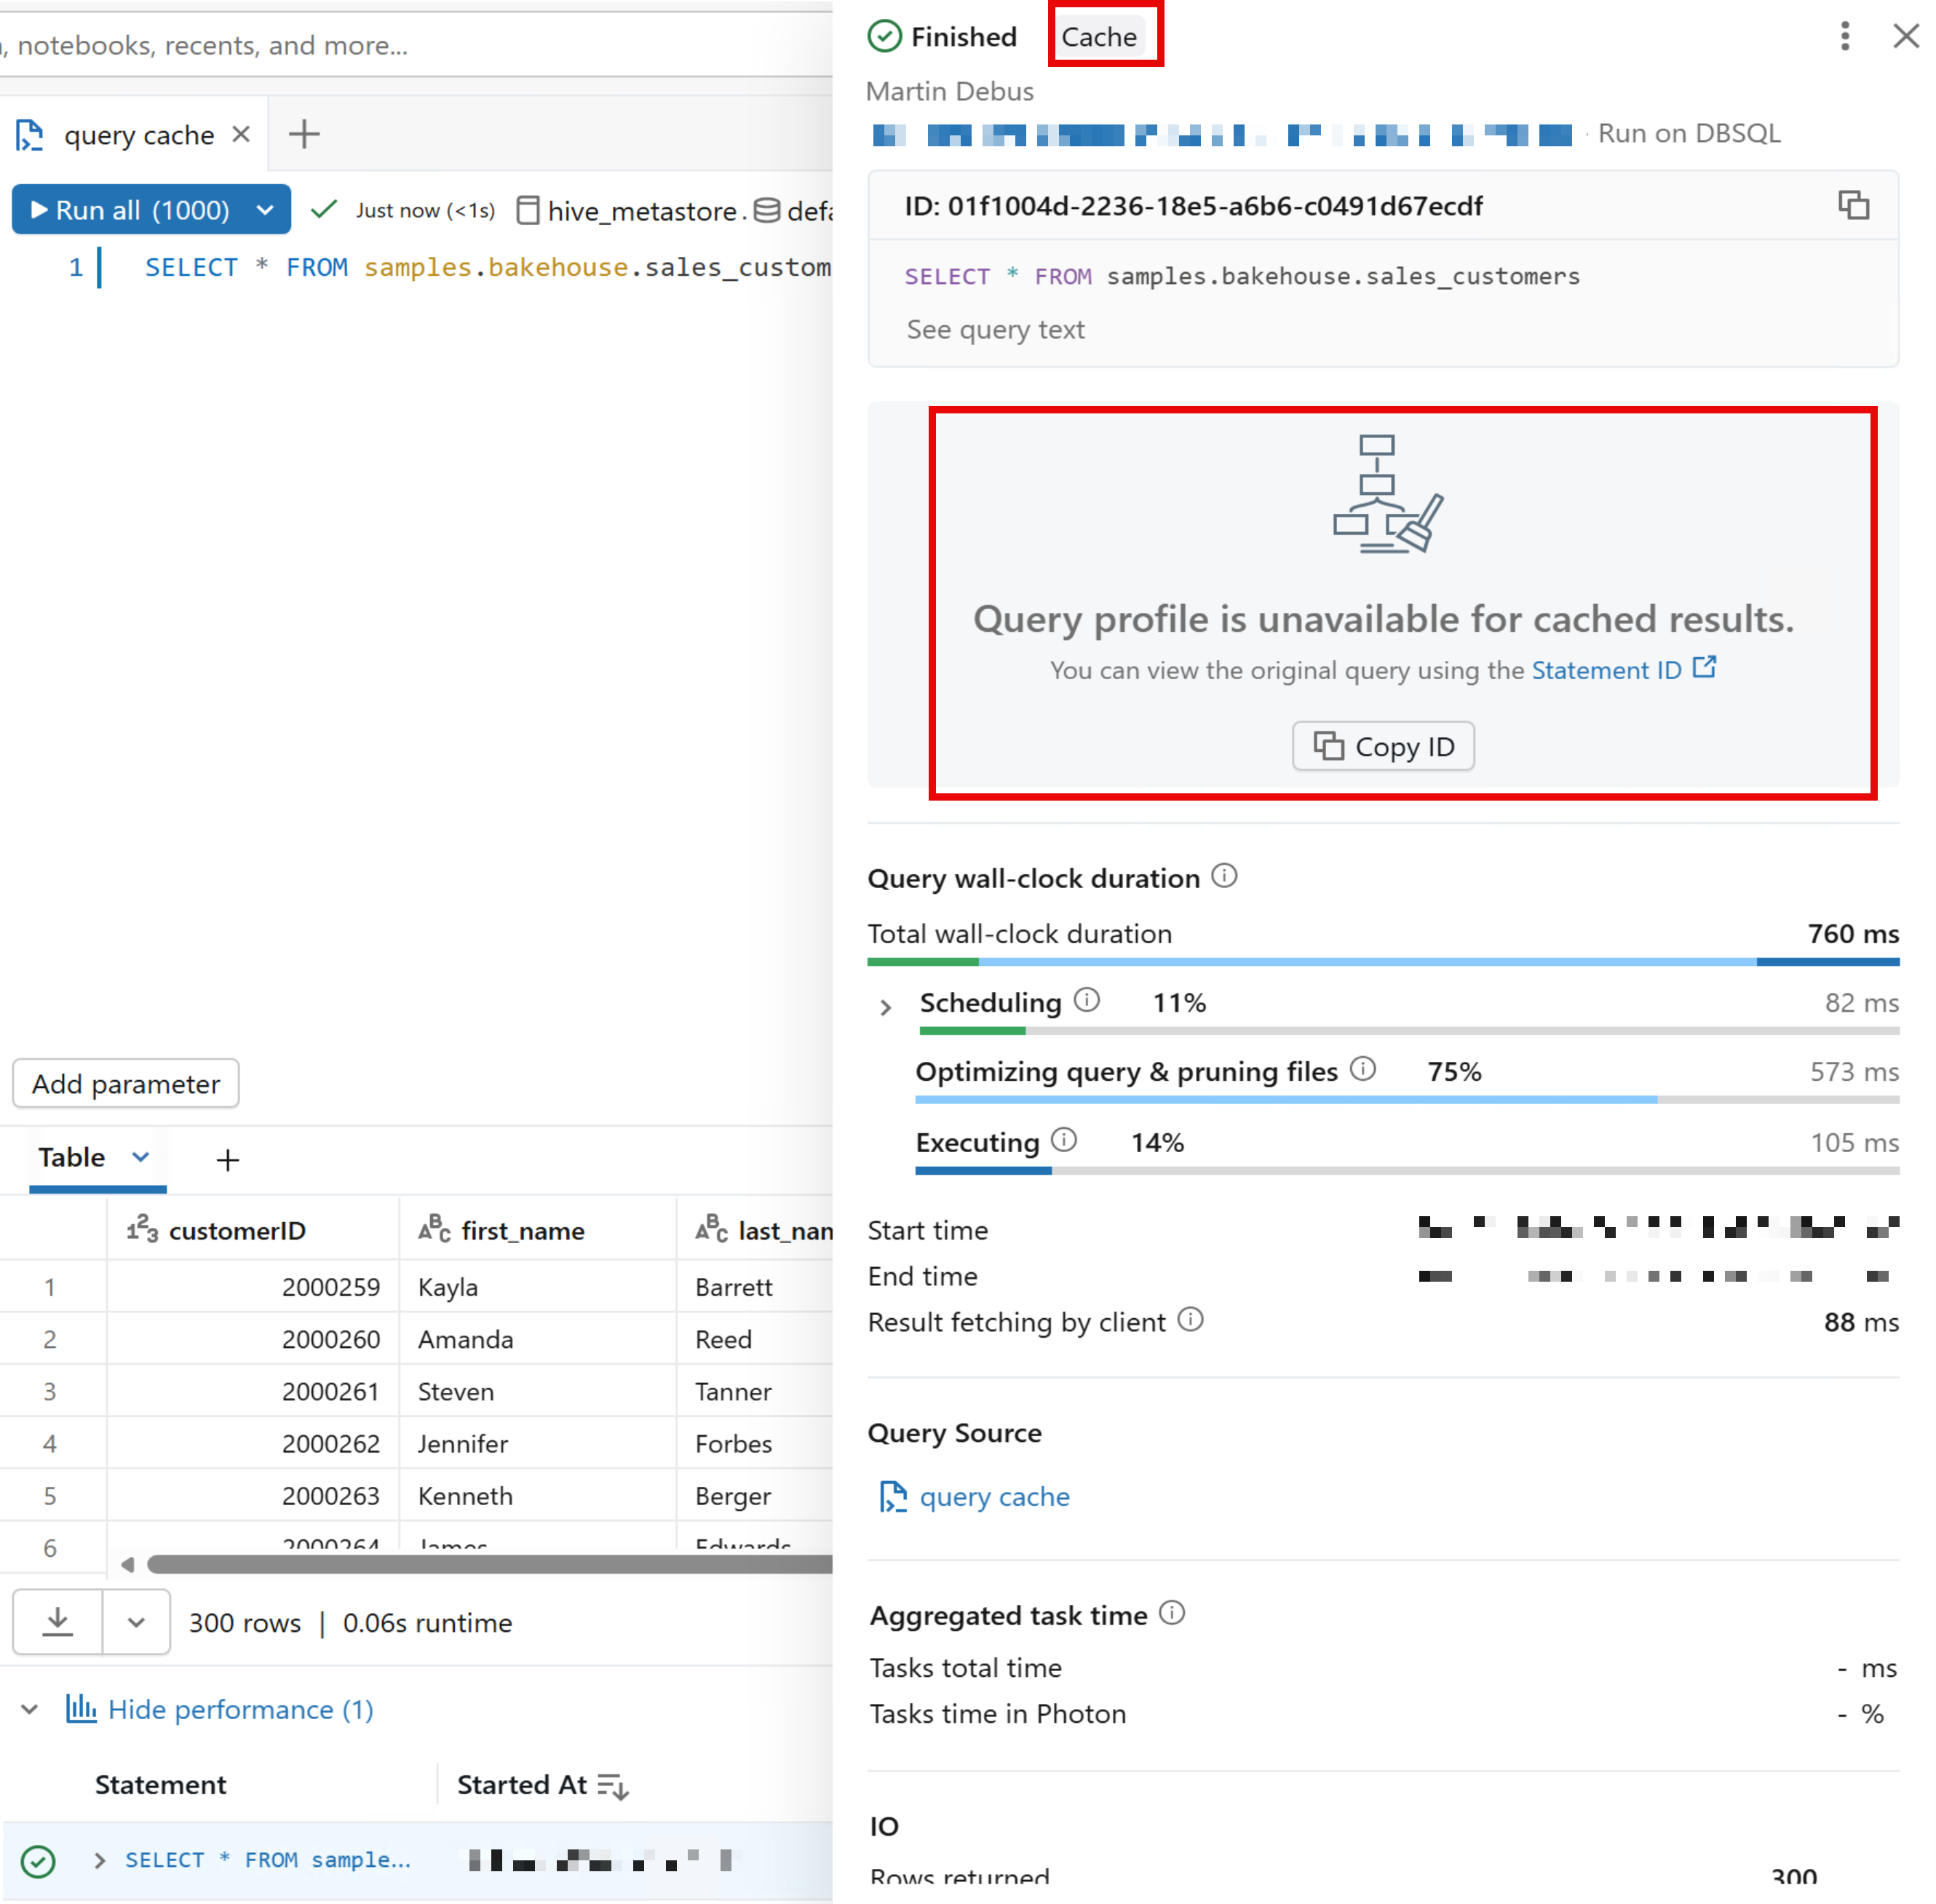
If a query is run for the first time, it is fully executed and stored in the cache.
-- First invocation, populates cache
SELECT
  *
FROM
  samples.bakehouse.sales_customers;
Subsequent queries will use the cached result. All these queries will utilize the cached results from the first query:
-- Reads from cache
SELECT
  *
FROM
  samples.bakehouse.sales_customers;

-- Reads from cache, too
select
  *
from
  SAMPLES.BAKEHOUSE.SALES_CUSTOMERS;

-- Still reads from cache :-)
SELECT
  *
FROM
  samples.bakehouse.sales_customers sc;
Note that the cache is not case-sensitive, SELECT * FROM table_name yields the same result as select * from TABLE_NAME. This is a thing that Snowflake handles differently2, because the cache there is case-sensitive.
Getting Query Details
To examine query execution details, use the system tables for query metadata. The following example shows how to retrieve caching information for specific queries from the system.query.history table:
SELECT
  statement_text,
  total_duration_ms,
  read_rows,
  produced_rows,
  from_result_cache,
  cache_origin_statement_id
FROM
  system.query.history
WHERE
  statement_id in ("put", "your", "statement_ids", "here")
This example shows four query executions—two distinct queries that were each run twice. Notice that when from_result_cache = true, the read_rows value is 0 and total_duration_ms is significantly lower. The cache_origin_statement_id field provides a helpful reference back to the original query that populated the cache.
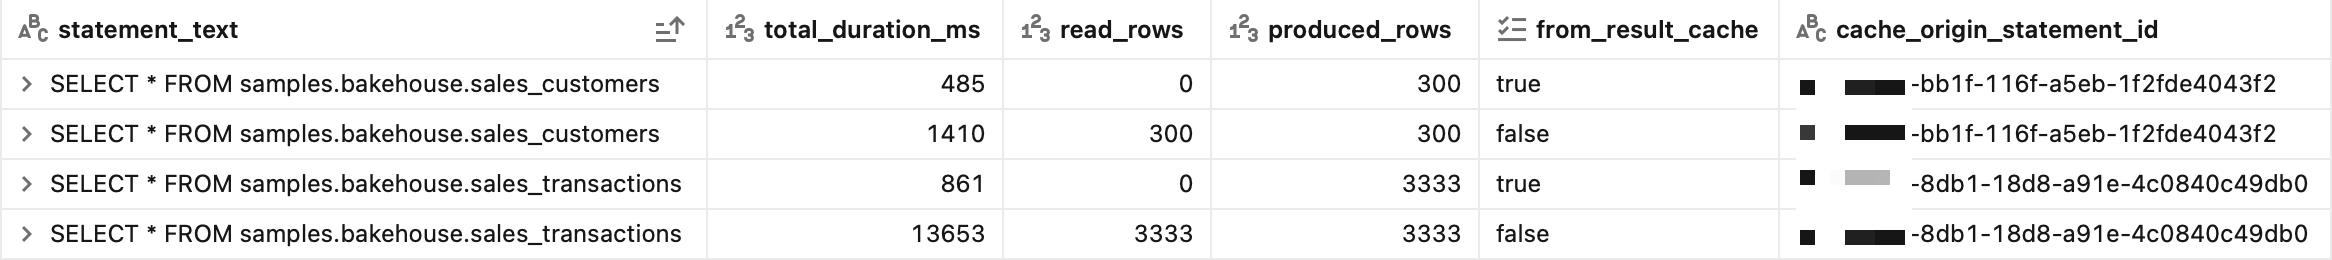
System tables like these are invaluable for administrators monitoring cache utilization and identifying opportunities to optimize queries for better cache performance.
Technical Details
There is not only one, but four layers of caches involved. They are checked in the following order:
UI Cache: a user-scoped cache in the workspace file system
Local Cache: the in-memory cache of the SQL Warehouse that is lost when the Warehouse is terminated
Remote Cache: this applies to Serverless Warehouses only and is shared by Warehouses across the Workspace
Disk Cache: the last resort for retrieving query results

Here are some more useful facts about caching:
The cache is invalidated after 24 hours or when the underlying tables get updated.
If you want to disable caching, you can add
SET use_cached_result = falseto the top of your script. This could be useful for true “cold” benchmarking of query performance.Because of the remote cache, switching from one Serverless Warehouse to another will utilize the cache.
Limitations
The remote cache is only available in Serverless SQL Warehouses. In practice, this means that the Warehouse can be terminated and started again, and the cache is still used. This will not work with Classic and Pro Warehouses.
Query caching does not work with dynamic views or functions like
current_timestamp(). Using this will lead to cache invalidation and execution of the query.Users have no control over the cache lifecycle.
The user cannot interact with the cache entries such as listing all cached queries or deleting.
Key Takeaways
Query caching in Databricks SQL can dramatically improve performance for analytical workloads with repeated queries. To make the most of it, design your queries to be cache-friendly by avoiding unnecessary dynamic functions, and consider using Serverless Warehouses when cache persistence across warehouse restarts is important for your use case.
Use the system.query.history table to monitor cache utilization and verify performance gains. The from_result_cache and cache_origin_statement_id fields provide valuable insights into which queries benefit from caching, helping you identify optimization opportunities and understand your workload patterns.
https://learn.microsoft.com/en-us/azure/databricks/sql/user/queries/query-caching
https://docs.snowflake.com/en/user-guide/querying-persisted-results