
Simple Python Logger Framework for Databricks, Part 1: Deliver Cluster Logs to a Volume
Part 1 of 3 of the Simple Python Logger Framework for Databricks series

Welcome to the Simple Python Logger Framework for Databricks tutorial. We will explore how to build a simple yet powerful Python logging framework with minimal effort in Azure Databricks. The tutorial is split into three parts, each covering a distinct topic:
Part 1 is about redirecting the Driver logs from Databricks Clusters to Volume in order to permanently store and analyze them.
In Part 2 we are creating a custom logger object in Python that can be used in the data processing framework of the Data Lakehouse.
Part 3 is on how the resulting cluster log files can be analyzed using Databricks onboard tools.
Why Logging Matters
When building a Data Lakehouse from scratch, most start by adding value through the integration of data sources. I believe this is the right approach because it allows you to deliver business value as quickly as possible. However, there are some downsides to this method. After integrating the second data source, you may realize that some kind of framework to automate processes would be very helpful. Otherwise, you risk ending up with a growing collection of ingestion and data transformation scripts that become difficult to manage.
As you progress, you might find that information about your processing is needed to debug or audit your data pipeline runs. More often than not, this leads to the use of print commands. While this approach is valid for debugging and development purposes, it is not suitable for a production environment.
Therefore, implementing a lightweight logging framework would be beneficial to keep things organized and structured. Here are some common use cases for logging in Data Lakehouses:
Good coding practice: Avoid using print statements in code; instead, use Python logging.
Keep logs for audit purposes.
Manage numerous job runs efficiently without manually searching through them; have all logs in one place.
Utilize log analytics frameworks like Azure Log Analytics.
Note: All technical details explained in this article apply for Azure Databricks in Azure region Western Europe. They were verified and tested by me in August 2025. They may be subject to changes by Databricks in the future. Feature enablement and technical details may vary for other regions and cloud providers. Please refer the official documentation.
These are the assumptions and prerequisites to implement this solution:
An Azure Databricks Workspace is in place.
A catalog was created in Unity Catalog and attached to the Workspace by an Account Admin.
You are an Admin or member of a special group like developers in the Databricks Workspace.
(Optional) You have a Service Principal that you are allowed to use in the Workspace and this service principal is Admin or in the special group like developers.
The steps described in the following sections will enable you to recreate it manually step-by-step. Creating a CI/CD process that can easily be deployed to several environments is explicitly out of scope for this tutorial. However, we take care that the resulting artifacts can be integrated into some CI/CD strategy (e.g. Azure DevOps, Databricks Asset Bundles, GitHub Actions) with low effort.
Driver Logs in Databricks
Every Compute type in Databricks creates log files. There are several log files for the driver, the executor, event logs and even init_script logs. We will focus on the driver logs here. They can be accessed in the Driver Logs section of a Cluster in the UI.
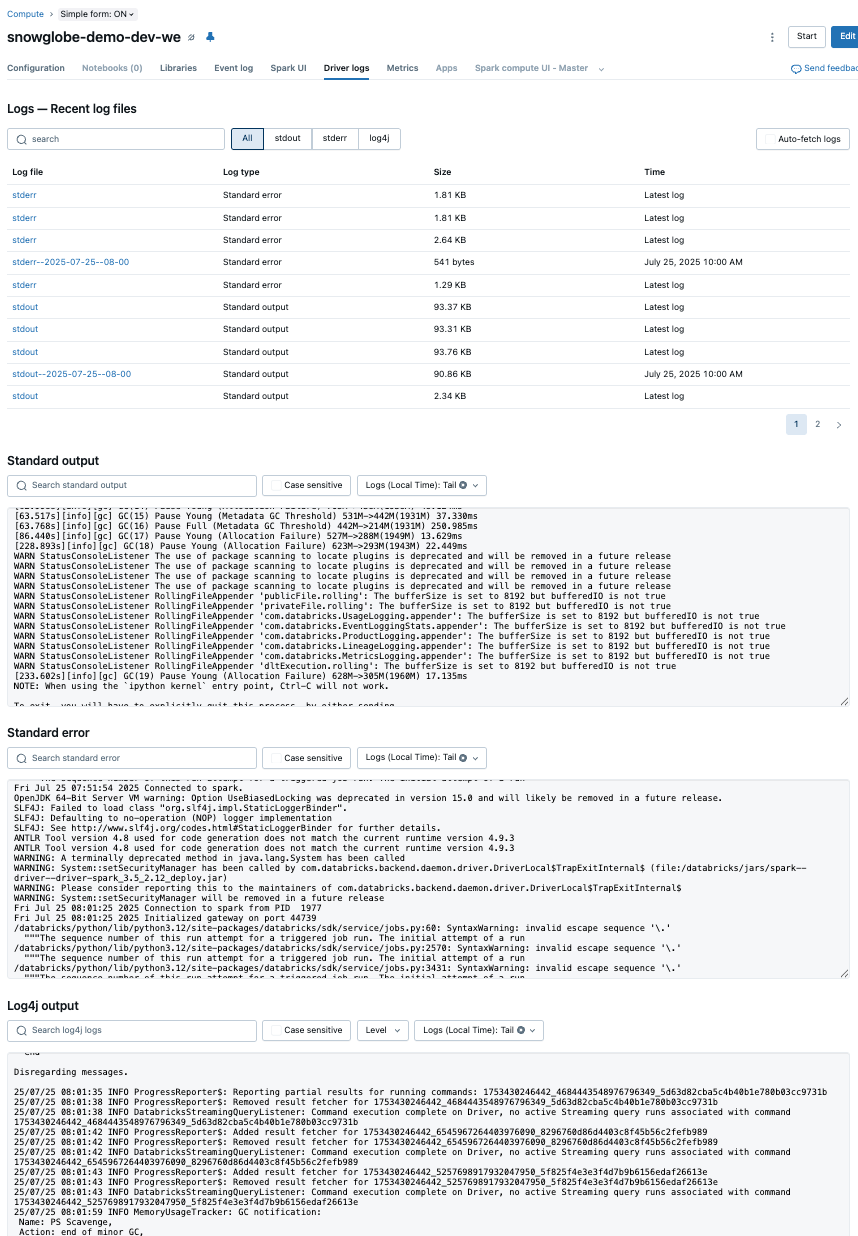
There are three types of driver logs delivered:
stdout (Standard Output): This log captures the standard output of the driver node. It typically includes the results of print statements, logs from user applications, and other output generated by the execution of code on the driver. It's useful for tracking the progress and output of your applications.
stderr (Standard Error): This log captures error messages and stack traces that are output to the standard error stream. It is particularly useful for debugging issues as it contains error messages and exceptions that occur during the execution of your code on the driver node.
log4j: This log contains messages generated by the Log4j logging framework, which is used by Databricks and many other Java-based applications. It includes detailed log messages from various components of the Databricks environment and your applications, allowing for comprehensive logging and monitoring.
By default, Databricks retains cluster logs (that includes the driver logs) for 30 days. They may also be manually be purged from the Workspace.
Redirect the Cluster Logs to a Volume
To permanently store the Cluster logs they can by redirected into a Volume. This feature was introduced by Databricks in March 20251. This is currently (as of August 2025) not available for Serverless Compute. Therefore this will not work with the Databricks Free Edition.
To set it all up, we will need to do these two steps:
Setup a Schema and Volume as a destination for the logs
Configure your clusters to write the logs to this destination
Create Schema and Volume
If you already have a Schema and Volume where system related data is stored, you can use them. If not, create a Schema and/or Volume as a destination for the logs.
I recommend creating there using code to apply via your CI/CD in all environments in the same manner. I assume you have a catalog tied to your workspace in Unity Catalog and you will be using this. I my case this the catalog is called snowglobe_demo_dev_we since it is for demo purposes on my dev environment in Western Europe.
In Databricks, create a new Notebook named something like init-system-schema. Put the following code in this Notebook:
# Create a Widget to get the catalog and schema name
dbutils.widgets.text("catalog", "snowglobe_demo_dev", "Catalog")
dbutils.widgets.text("schema", "system", "Schema")

# Get the catalog and schema name
catalog = dbutils.widgets.get("catalog")
schema = dbutils.widgets.get("schema")

# Create a managed Schema system
spark.sql(f“CREATE SCHEMA IF NOT EXISTS {catalog}.{schema}”)

# Grant access for developers group (including SP)
spark.sql(f"GRANT ALL PRIVILEGES ON SCHEMA {catalog}.{schema} TO `developers`")

# Create a managed Volume logging
spark.sql(f"CREATE VOLUME IF NOT EXISTS {catalog}.{schema}.logging")
# Create a managed Volume package
spark.sql(f"CREATE VOLUME IF NOT EXISTS {catalog}.{schema}.package")
The catalog and schema name can be dynamically set by a Widget in order to work in different environments and may be injected via a Job Parameter. I am going with the name system for the Schema and logging and package for the Volume to describe their purpose.
Note that the developers group gets all privileges on the Schema. You may want to restrict that in a production environment.
Run this Notebook in interactive mode or create a Job with one Task running this Notebook. I would recommend running it as a Job in the name of the Service Principal.
Now, we have set up the location where the log should be delivered. In the next step we will make sure the log are delivered to this location.
Configure Clusters
There are several ways to configure the clusters to deliver the cluster logs to the Volume. You can use one or any of them to fit your needs.
Databricks Web UI
The most basic way ist to simply use the Databricks UI to configure a cluster to deliver the log to the Volume.
Go to the Cluster and click
EditGo to
Advanced OptionsSelect the
LoggingtabSelect
Volumeas DestinationBrowse your Catalog to the Volume and select it as path or simply paste the path into the field
To quickly go ahead and try things out, this is definitely the way to go. However, this is not very convenient for multiple clusters and environments, so it might be advisable to automate this using Terraform or configuration files. We will briefly cover those in the next sections.
Terraform
If you are deploying your Databricks resources like clusters and/or jobs via Terraform, simple add this to the databricks_cluster resource2:
cluster_log_conf {
  volumes {
    destination = "/Volumes/${local.catalog_name}/system/logging/"
  }
}
This assumes that the catalog name is set in the Terraform locals to keep it dynamic.
Job Cluster Configuration
If you manage your jobs using yml-config files, add the following to the job configuration:
cluster_log_conf:
  volumes:
    destination: /Volumes/{catalog}/system/logging
Cluster Policies
Cluster Policies are also a convenient way to configure cluster log delivery. You can either to it by hand and overwrite the policies or use the Databricks SDK to automate it and apply dynamic resolution of environment specific variables. The code looks quite similar to the job cluster configuration:
cluster_log_conf.path:
  type: fixed
  value: /Volumes/{catalog}/system/files/cluster_logs
Detour: Resolve Variables in Configuration Files
In order to dynamically resolve variables like the catalog that might vary between environments, you can apply some custom Python functions to the configuration files.
First, add a function that recursively formats values in a dictionary or list. The format_values dictionary contains the mapping of the actual variables to values like “catalog” : “snowglobe_demo_dev_we”.
def format_dict_values(
    dictionary: dict, format_values: dict = {}
) -> dict:

    def recursive_format(obj):
        if isinstance(obj, str):
            return obj.format(**format_values)
        elif isinstance(obj, dict):
            return {k: recursive_format(v) for k, v in obj.items()}
        elif isinstance(obj, list):
            return [recursive_format(item) for item in obj]
        else:
            return obj

    return recursive_format(dictionary)
Second, when reading the configuration, e.g. the jobs.yml where jobs are described, create a mapping dictionary and apply the format_dict_values function to the configuration. In our case, the implementation of the get_catalog_name() function dynamically returns the currently used catalog (e.g. the dev or prod catalog). When applied to the configuration file, the variables {catalog} will be replaced with the actual value during runtime.
import yaml

with open(f"{path}/jobs.yml", 'r') as file:
  jobs_config = yaml.safe_load(file)

mapping = {"catalog": get_catalog_name()}

jobs_config_mapped = format_dict_values(jobs_config, mapping)
Wrap Up
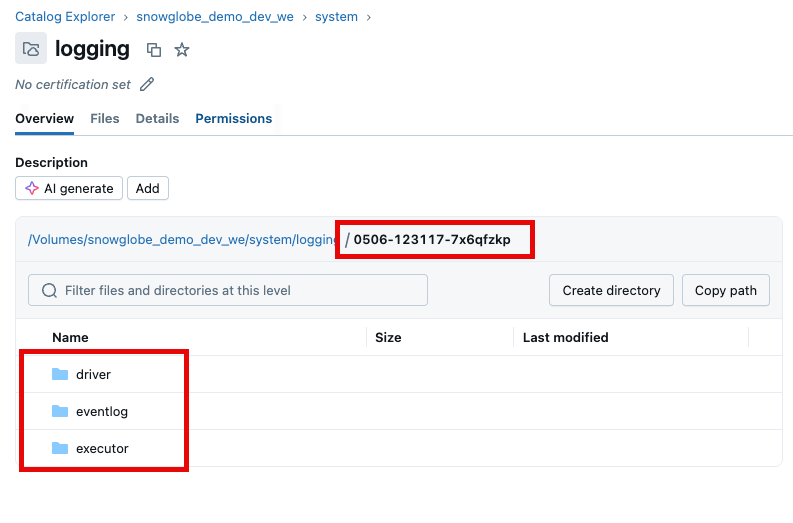
After the cluster log destination is configured, the cluster logs are delivered every five minutes to the Volume based on a best effort method. That means:
If the Volume does not (yet) exists, the logs are not delivered. This is done silently, so no error occurs.
The user running the cluster must have write access to the Volume. If not, the logs are not delivered.
The logs show up in folders named with the corresponding cluster id.
This concludes the first part of the series Simple Python Logger Framework for Databricks. The next parts of this series are:
Terraform Databricks Cluster Resource Documentation: https://registry.terraform.io/providers/databricks/databricks/latest/docs/resources/cluster