

This is the last post in a four-part series. Part 1 set up the project scaffold. Part 2 covered connecting to the LinkedIn API and landing raw JSON in a Databricks Volume. Part 3 covered the implementation of the medallion pipeline.
In the final part of this series, I will build a basic dashboard on top of the data. Additionally, we will look into the cost of running this pipeline with serverless vs. classic compute. Finally, I will summarize what I have learned along the way and what I would do differently when starting over again.
Building a Dashboard
Based on the gold table daily_metrics a Databricks dashboard can be created to give an overview of the different metrics.
We will build the dashboard manually and later add it to our bundle to properly deploy it to the different target via Declarative Automation Bundles (DABs).
First, go to Dashboards, click Create Dashboard to create a new dashboard. In the data tab, add the following SQL to fetch the data from the table:
SELECT * FROM gold_linkedin.daily_metrics WHERE date >= to_date("01MAY2024", "ddMMMyyyy")After that, you can either take my dashboard from the repo or build something that looks like this:
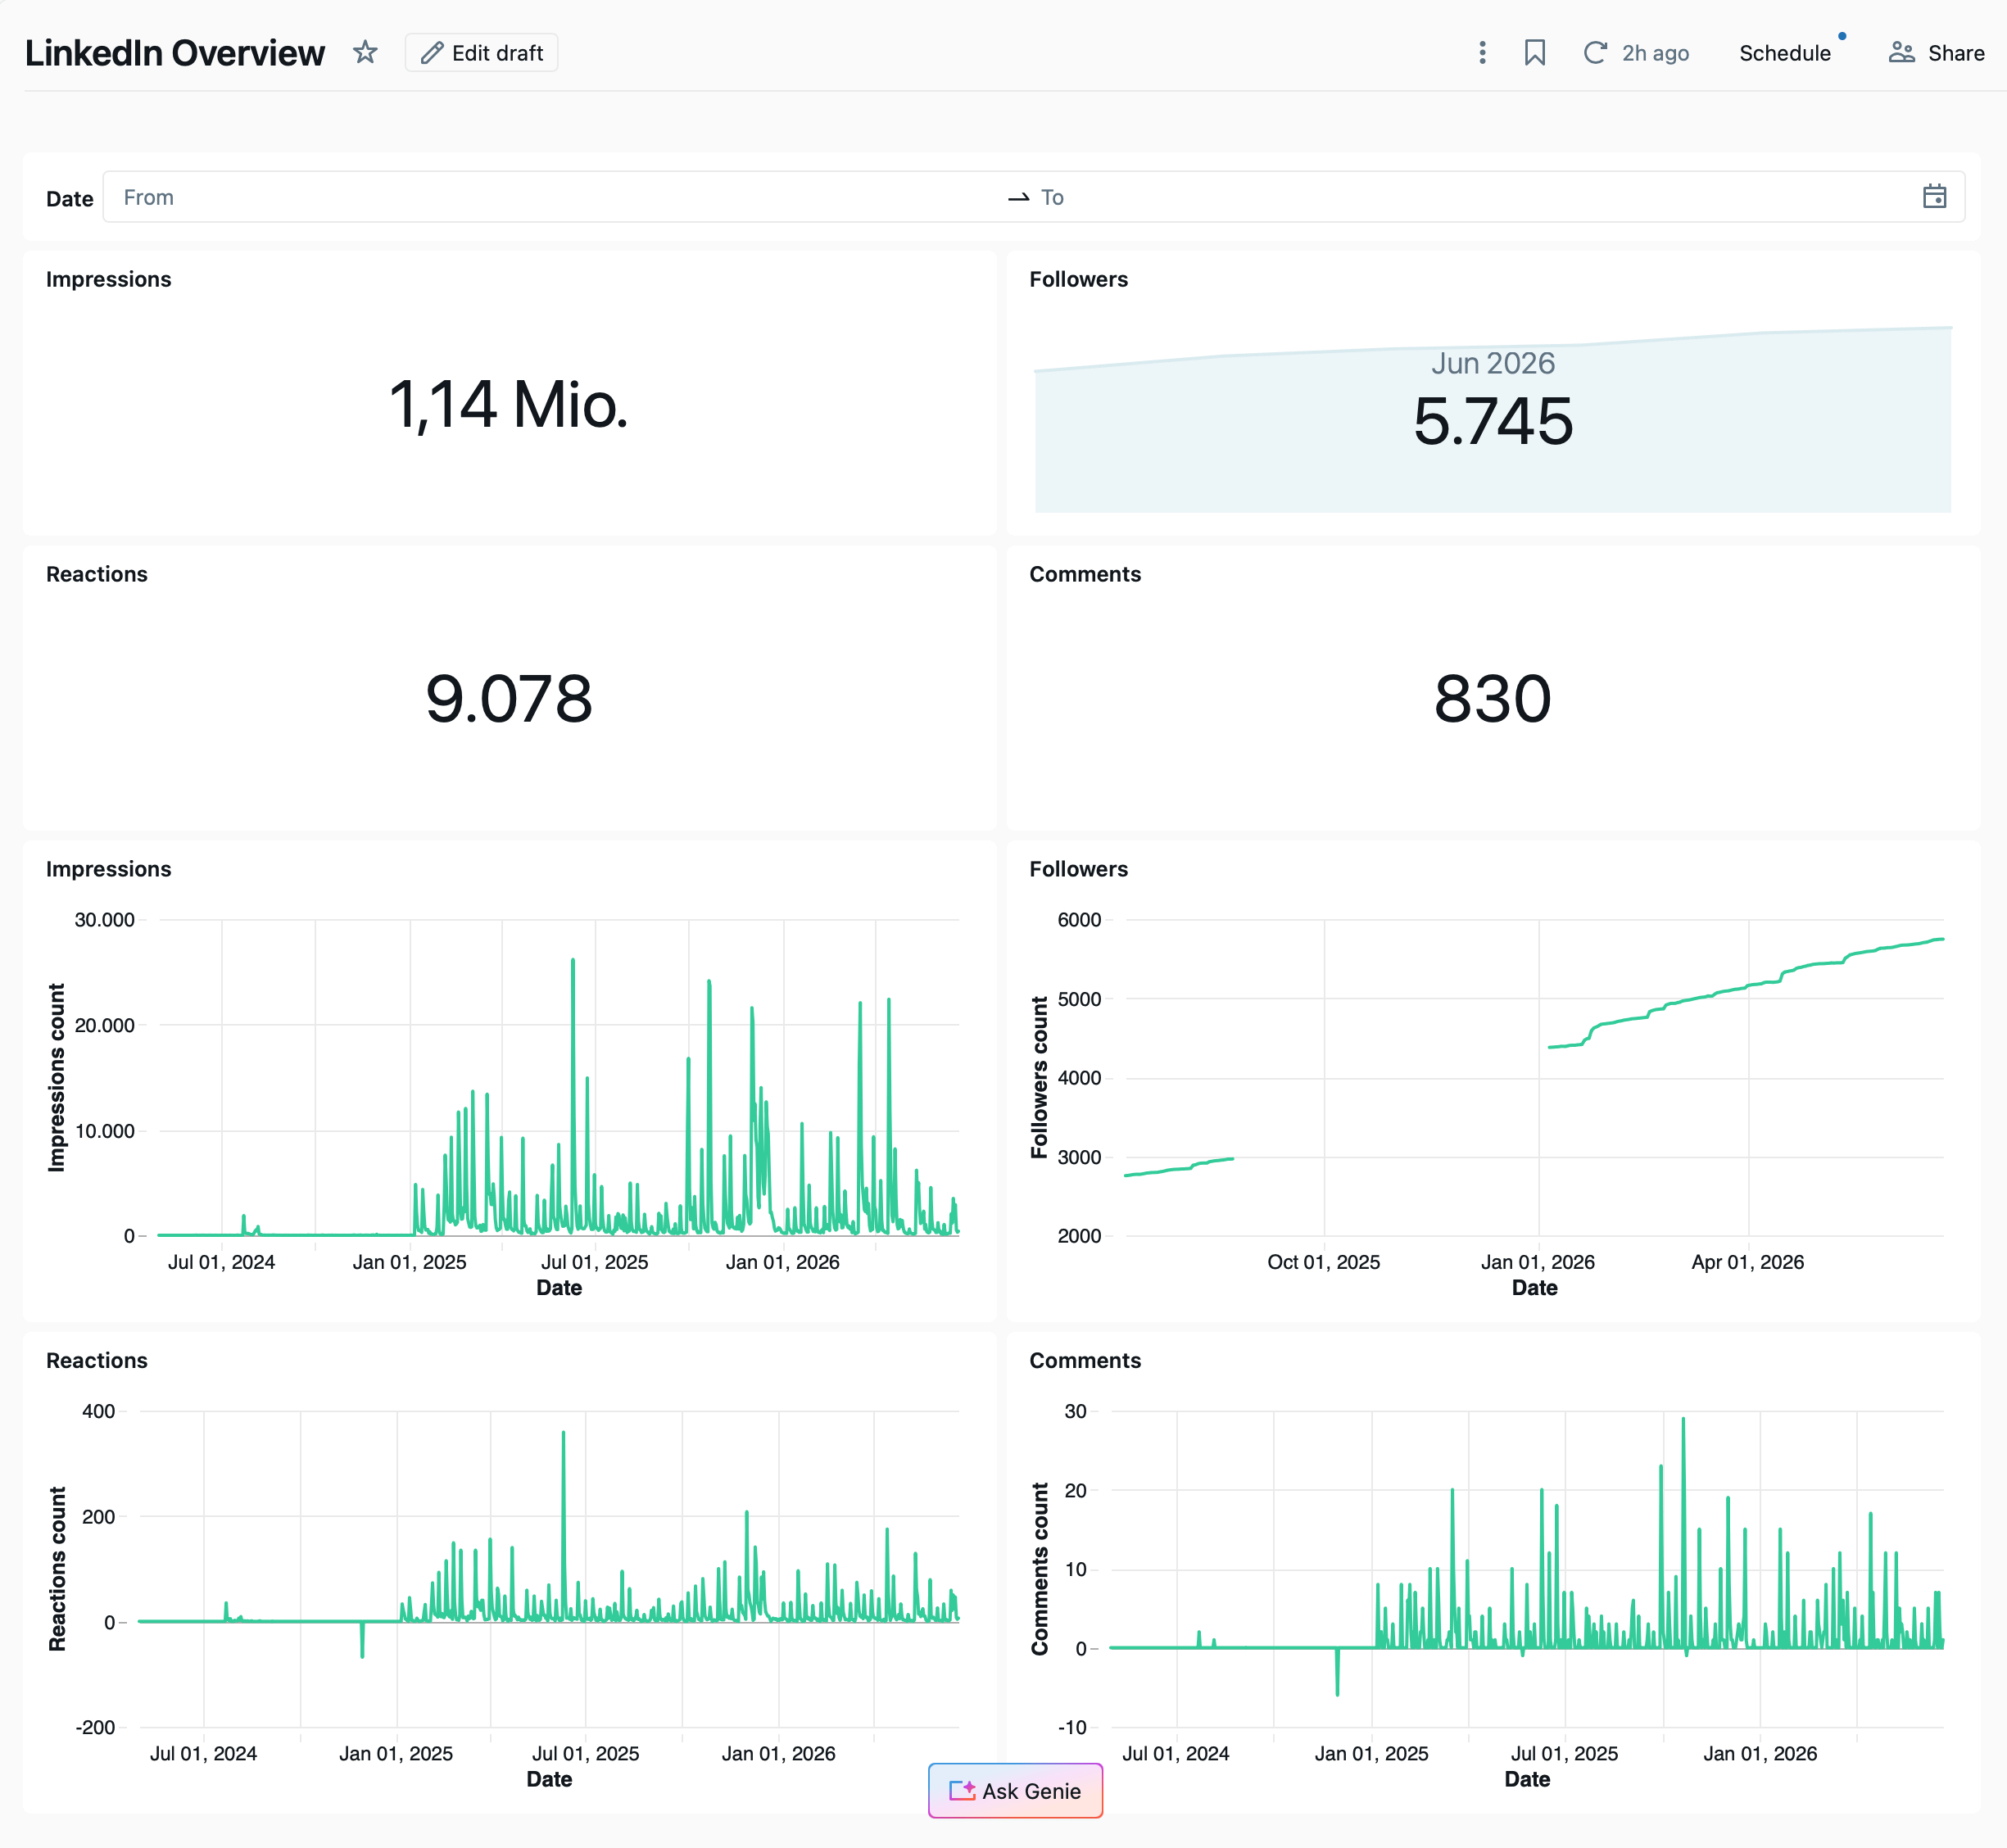
Note that my follower count timeline is broken from September to January. This was the period of time where the API silently failed due to an expired token. All other data could be backfilled, but not the daily absolute follower count. As you can see, I only started posting on LinkedIn on a weekly basis beginning in January 2025. I am quite happy with the overall metrics though I do not optimize my content for maximal impressions.
The dashboard definition will be stored as <dashboard-name>.lvdash.json file inside your Home directory in the Workspace. We put this in our src folder in a separate dashboards folder alongside our pipelines and notebooks.
Additionally, in order to deploy the dashboard properly through DABs, we have to create a dashboard.yml containing the resource to deploy.
resources:
  dashboards:
    linkedin_overview:
      display_name: LinkedIn Overview
      file_path: projects/linkedin/src/dashboards/LinkedIn Overview.lvdash.json
      warehouse_id: ${resources.sql_warehouses.serverless_warehouse.id}
      embed_credentials: false
With the next deployment, the dashboard will be deployed alongside the other resources.
The full code is available in the accompanying GitHub Repo. Click the button below to view the repo.
Pipeline Cost
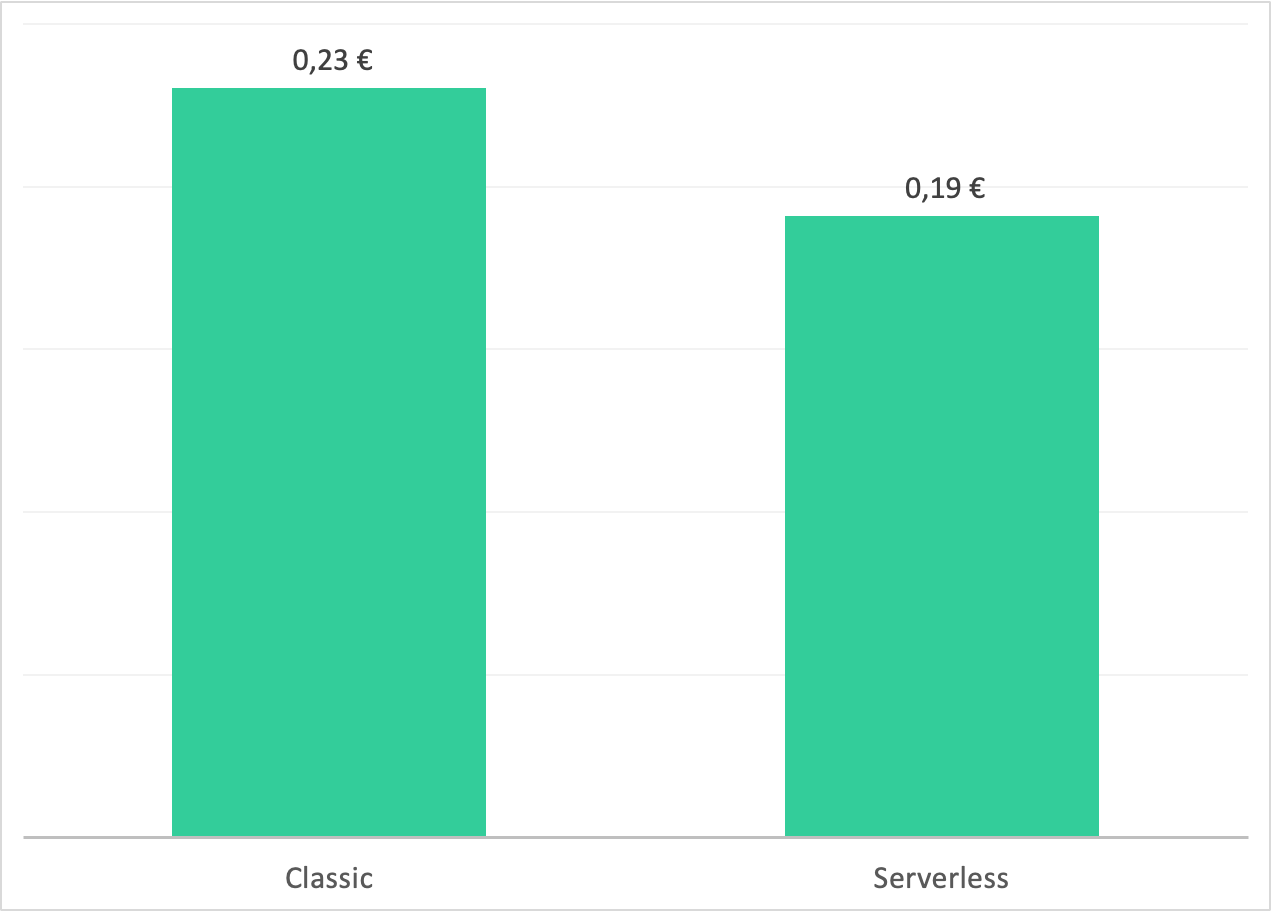
The pipeline was running over several weeks on classic compute and then several weeks on serverless compute. The classic compute costs 0.23€ per run, including Databricks DBUs as well as VM Cost on the Azure side. The serverless compute costs 0.19€ per run. So serverless wins in terms of cost. Though as a general rule, serverless is more expensive than classic compute, you have to add the startup time of the classic compute. Cost will be charged for the approximately five minute startup time as well. We do not handle large amounts of data, so the pipeline finishes very quickly.
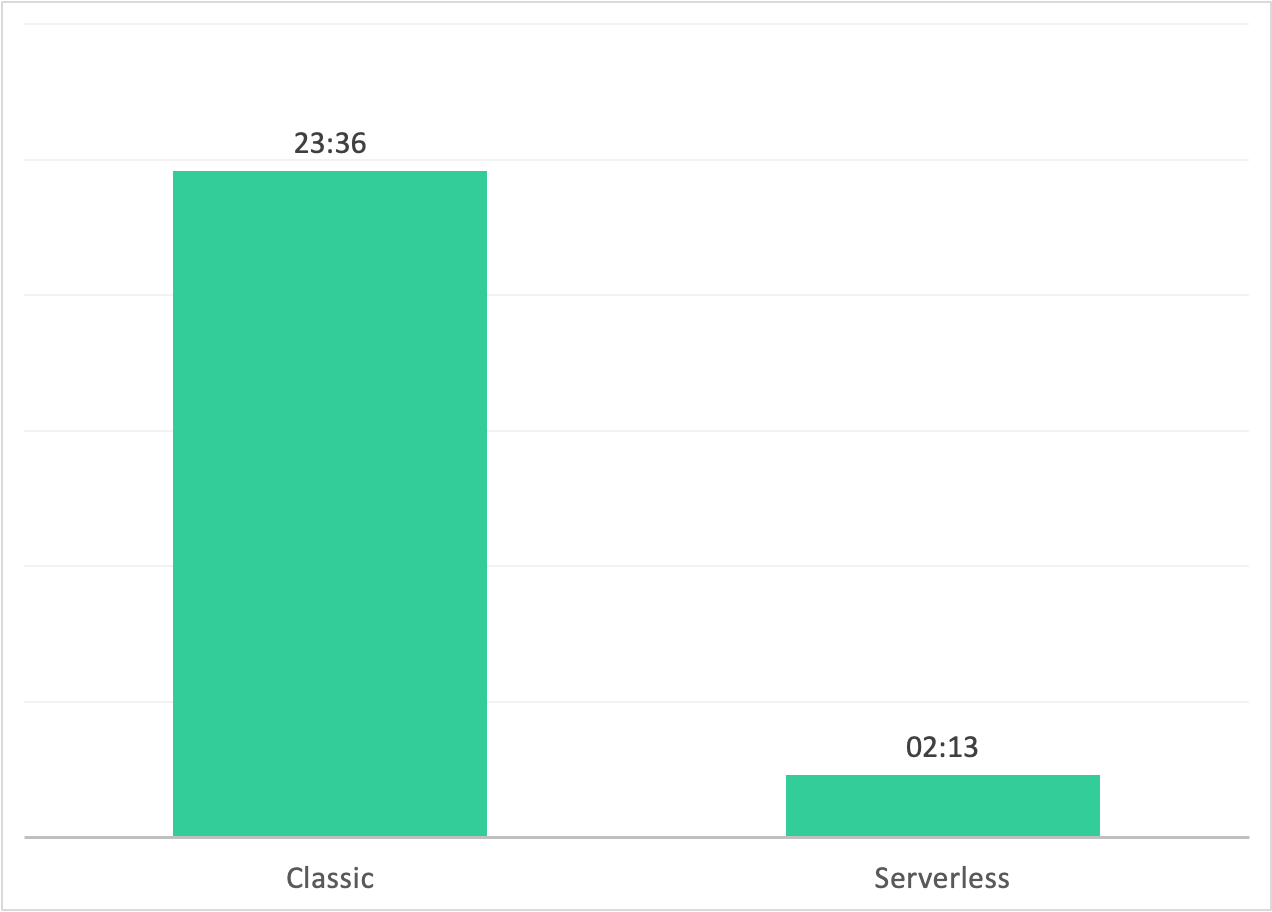
Looking at the average runtime per job run per compute type, you can see that serverless runs only for 2 minutes and 13 seconds on average while the classic compute takes 23 minutes and 36 seconds to finish. This is due to the startup of a compute for the ingest and another compute for the Declarative Pipeline which requires a different type. With such small amounts of data, serverless is the undisputed go-to solution.
The Bottom Line
To sum things up, using the LinkedIn API is quite a good example to build an end-to-end process to send the data through the medallion layer. Is it worth it compared to what you get from LinkedIn analytics? Hard to answer, and it is definitely not a big yes. So what do you get:
the data is yours once landed on the platform.
you keep the full history while LinkedIn cuts off impressions etc. after approximately 14 months.
you are free to analyze the data.
On the downside, I see the following:
I initially wanted to pull data for individual posts. That would have been the biggest benefit for me. Though the API documentation states it should work, I did not manage to achieve that (see Part 2 of this series).
The basic metrics are provided by LinkedIn at no extra cost and without maintaining a pipeline.
After all, I learned a lot along the way and have some ideas to take this to the next level:
Try the newly released version of the API (July 2026). Maybe the posts metrics will work with that.
Use a third-party API like Buffer to pull analytics as well as the content.
Throw metrics and content at an AI in order to discover what works and what could be improved for future posts.